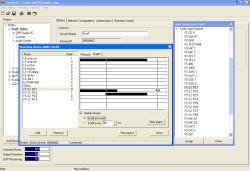
Using this command, you open the Maintenance Window. In this window, you have direct access to the modules of the RM4200D and you can carry out important adjustment and maintenance measures. There are several functions in this window, they are dealt with in a separate chapter. (see Maintenance Window — Maintaining the Modules)
![[Note]](../pics/note.gif) | Note |
|---|---|
The functions that can be carried out in the Maintenance Window do not affect an open project file. If you want to use the Toolbox4 software for maintenance functions only, there is no need to open a project file. | |
The maintenance window can also be opened by pressing F7.
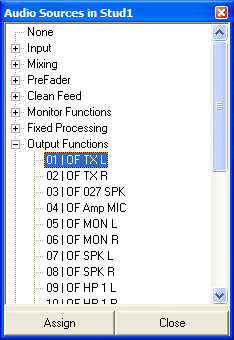
This window shows all internal audio signals available for the configuration of the selected Device. The appropriate Device must be selected in the project tree. The name of the current Device is displayed in the title bar of the window. The audio signals are subdivided into groups according to their characteristics.
![[Note]](../pics/note.gif) | Note |
|---|---|
For various functions, in the Audio Sources Window you can access signals that are provided by remote Devices. In this case, the name of the appropriate Device is displayed in the title bar of the window. (see also Global Pool Lines - Using Pool Signals between several Devices) | |
Please note that this window shows two different types of internal signals that can vary depending on the selected functions:
Audio channels available on the internal TDM bus system: Inputs, Mixing (Sums, Groups, Aux buses), Pre Fader (Fader Channels after Input Processing), Clean Feeds, Monitor Functions (PFL only), Fixed Processing, Output Functions.
Internal “virtual” audio sources: Monitor Functions (Monitor buses 1 - 6, Rotary Monitor Selector 1 - 10), Routing (Number 1 to 768).
For the inputs of Output Functions, you can use all internal virtual audio sources. The internal virtual audio sources can be used for Output Routing, too.
As inputs for the other DSP functions, only the audio channels on the internal TDM bus system are available.
If you use the Audio Sources Window when configuring the Output Functions, it will be extended by the entries Level, Potentiometer and Phase Reverse. (see also Output Functions)
You can also open the window by pressing the F6 key.
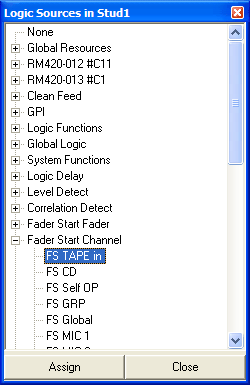
This window shows all internal logic signals available for the configuration of the selected Device. The appropriate Device must be selected in the Project tree. The name of the current Device will be displayed in the title bar of the window. The logic sources are subdivided into groups according to their characteristics.
If you use the window to select logic sources as inputs for Global Logic Functions, the windows shows the logic sources of all Devices in the current project.
You can also open the window by pressing the F5 key.
Global Logic Functions (Global Logics) are used to exchange logic signals between different Devices. This is carried out by UDP commands over an Ethernet connection. You can check the signalling between the Devices by using the window Global Logic Monitor.
![[Note]](../pics/note.gif) | Note |
|---|---|
The functions of the Global Logic Monitor do not influence an open project file. If you only want to use the Global Logic Monitor, you only need to open the project file to select the project ID of the system to be monitored. Alternatively, you can create an empty project and insert its ID manually into the tab . (see also Project Options) | |
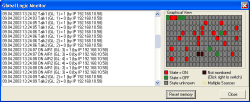
The window Global Logic Monitor displays all events both as text and graphics. On the left, you find the events listed with time, name, sent state (logical 1 or 0) and the IP address of the sender. On the right, there are 200 boxes in 10 rows of 20 columns. Each of the boxes displays the logical state of one of the 200 Global Logics available.
![[Tip]](../pics/tip.gif) | Tip |
|---|---|
Move the cursor over one of the boxes and leave it there for a second. A tooltip displays the number of the underlying Global Logic function. | |
You can also set the logical states in the graphical display. Click once or twice in the box of the selected function to set the desired value. In return, the box changes its color and the corresponding result is displayed.
The colors of the boxes show the state of the corresponding logic function. They have the following meaning (also refer to the explanation on the display under the graphic):
Red, State = ON: The logic function has the state logic 1.
Green, State = OFF: The logic function has the state logic 0.
Grey, State unknown: The state of the logic function is temporarily unknown until the appropriate UDP command sets the state of a function. Manually, you can reset all currently displayed states by pressing the button . In this case, all boxes are grey again.
Black, Not monitored: The display for the selected function is hidden, the corresponding events are not shown in the list. You can use this function if some states change very often and therefore disturb the display. Right-click in the desired box to toggle this filtering.
Hatched, Multiple Sources: If the state of a Global Logic function was set by more than one Device, the corresponding box is displayed hatched.
The state of a Global Logic Function is displayed in grey (State unknown), as long as it is unknown. This changes as soon as the appropriate UDP message arrives carrying the state. In every second, the state of one Global Logic Function is transferred to all Devices in the project. This way, 200 seconds after opening the window Global Logic Monitor, the states of all Global Logic Functions have been transferred at least once.
With this dialog, you can watch the state of certain logic sources within a Device. This is especially helpful for error detection in more complex applications, in which logic functions are e.g. linked to each others.
![[Important]](../pics/important.gif) | Important |
|---|---|
You can not watch all logic sources that are available in the RM4200D. For technical reasons, certain signals can not be watched. But this should not be your concern – if you add new logic sources to the watches, the possible selection in the Logic Sources Window is filtered already. (Further information is provided later in this book.) | |
If you want to watch logic signals, use the following steps:
Make sure the Device to be watched can be reached from the PC via a TCP/IP or serial connection.
Load the project file that contains the Device to be watched.
In the project tree, select the Device that you want to watch.
Select from the menu. The DHD Connection Dialog opens. Select the Device that you want to watch. Make sure this is the same Device that is selected in the project tree! Click on the button . The window Watches opens.
![[Important]](../pics/important.gif)
Important If you set up a connection to a Device different from the one selected in the project tree, you can not select the logic sources in the next step correctly! Make sure the Device is exactly the same!
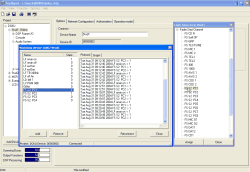
In the left part of the Watches window, there is a list with the logic sources that you are watching. The names of the logic sources are displayed, as well as their current state. There, “1” means that the logic source is active (or “on”); “0” means “inactive” (or “off”). Click on the button to add logic sources to the list. Choose the desired logic sources from the Logic Sources Window.
In the right part of the window, there is a protocol of state changes for the selected logic sources.
State changes can be displayed in two ways: as protocol (tab ) or as graph (tab Graph). Click on the appropriate tab to choose the desired display.
In the protocol view, all state changes for the logic sources you are watching are recorded. The protocol contains date, time and the type of state change. Using the mouse, you can highlight the lines in the protocol, copy them into a text editor and then delete them. To do that, use the context menu in the pane of the protocol view.
In the graph view, all states of the logic functions are displayed graphically over a certain period of time. This way, you can analyse the processes and dependencies of functions. So, errors in nested logic functions can be detected easier than in the protocol view. Active states (on) are displayed black, inactive states (off) stay transparent.
You can use the checkbox Update Graph to control the display update. When you activate the checkbox, all state changes are recorded and displayed. If you then deactivate the checkbox, you can analyse the graph without other data disturbing the display. When moving the cursor over the graphs, a movable line is displayed. That way, you can easily check whether two state changes happened at the same time.
You can control when the display of the graph is to be updated:
Scroll per event: As soon as one of the watched logic sources changes, the display is updated by one unit. (One unit is approx. 1 mm wide.)
Scroll every <x> ms: The display is updated at regular time intervals. This is e.g. useful to analyse delayed functions (Logic Delays). Use the entry box or the arrow keys next to it to enter the desired interval. You can define intervals between 20 ms to 10 sec.
![[Note]](../pics/note.gif) | Note |
|---|---|
Please note that for long update intervals, the graph may not be able to display quick changes of logic functions to a full extend if they happen outside the update time. | |
The buttons in the Watches window have the following functions:
Add: Click on this button to add logic functions to the watch list. The Logic Sources Window opens to select the desired signals. Each logic source can be selected only once for watching.
![[Important]](../pics/important.gif)
Important Make sure to always use the button Add to open the Logic Sources Window. Only this way you can be sure that all displayed logic functions can really be used.
Remove: Click on this button to remove highlighted entries from the watch list.
Clear Graph: This buttons deletes the graphic display of the logic states.
Reconnect: If the TCP/IP connection to the watched Device has been interrupted, you can restore it using this button.
Close: This button closes the Watches window.
The DSP-load of the Device selected in the project tree can be checked with the Fitting Report. This command creates and opens a text file describing the DSP-load of the selected Device.
This command is only available if a Device is selected in the project tree; otherwise its is not active. This command can be executed by pressing the key combo Ctrl+R.
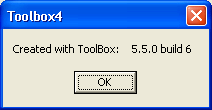
With the aid of this command you can determine which Toolbox4 version was used for generating the currently opened configuration.
The Toolbox4 version is displayed in the following format: 5.5.0 build 6 (example). Here the information accord to the specifications in the - menu of the Toolbox4 used for the configuration.
The versions of the currently used Toolbox4 and of the opened configuration may differ. Only on saving the configuration, the value is changed.
