Normally, the DHD Communication Server runs automatically in the background as soon as you start a DHD application. The server carries out all the UDP network communication for all DHD applications without a need for you to bother. At the same time, it records the UDP messages sent by DHD Devices in the network.
You can use this feature of the DHDCS to monitor and record the function from one or more RM4200D systems in the network. Doing so, the software receives UDP- and CAN-Bus-messages via the network and can save this data in log files. (see Overview)
![[Important]](../pics/important.gif) | Important |
|---|---|
Since its introduction, the DHD Communication Server is the only application that is able to record UDP- and CAN-Bus-messages and write them in files. | |
If you want to access the extended functions of the DHDCS, you first have to open its application window. For that, do the following:
Make sure the DHDCS is active. To do that, start any one of the DHD applications, e.g. Toolbox4. You recognize an active DHDCS when the small orange DHD logo is displayed in the icon tray of the Windows task bar.
Double click on this logo. The DHDCS application window opens. Alternatively, you can also right-click on the icon and use the context menu. Use the command to open the window.
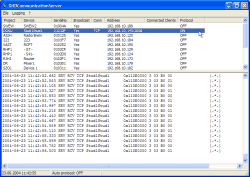
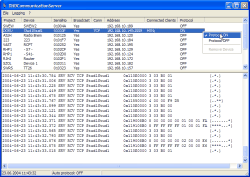
The application window consists of the following parts (top to bottom):
Menu bar. Here you find menu commands that can be used to control the extended functions of the DHDCS.
List of Devices. Here, all Devices in the network visible to the DHDCS are listed. The Devices in the list have registered automatically using UDP broadcast messages. In addition, you can add Devices manually. The listed details for each Device are explained in the next section. (see also Add Device)
Logging area. Here, all messages are displayed that are transferred from the Devices to the DHD Communication Server. The data can be transferred via the serial port or via Ethernet using the TCP/IP or UDP protocols. You can filter the display in the protocol section using the settings in the Extended Logging dialog. (see also Options, Extended Logging)
![[Tip]](../pics/tip.gif)
Tip You can shift the divider between the Device list and the logging area by clicking and dragging it.
Status bar. Here, the current date and time are displayed. You can also see whether the option Auto Protocol is active or whether and how messages are filtered in the protocol area. (see Options, Logging)
In the area below the menus, all Devices are listed that are available to the DHD Communication Server. Devices that can send UDP broadcast messages to the PC with the DHDCS are registered automatically and added to the list. Apart from that, you can use the command to add Devices manually. (see Add Device)
The list is subdivided in eight columns displaying the following information for each Device:
Project. This is a four-digit project ID of the Device, which is broadcast by the Device.
Device. These are the first ten characters of the Device name as broadcast from the Device.
Serial No. This is the serial number of the Device. It corresponds to the last three bytes of DHDs own Ethernet MAC address. If the Device was not automatically registered via the UDP protocol, this information is not available.
Broadcast. The value Yes means that the Device is broadcasting UDP messages. If this column is empty, there is no UDP connection possible at the time.
Conn. Here, the kind of data connection is indicated. COM means that the Device is connected to the PC via a serial port. TCP means that there is a direct connection using the TCP/IP protocol.
Connected Clients. In this column is indicated, which DHD applications are connected to the corresponding Device. The abbrevations have the following meaning:
“TB4”: Toolbox4
“TBX”: Toolbox45
“SMR”: Setup Manager
“SRV”: DHD Communication Server
“MTN”: Maintenance Window
“RT4”: Route
“RCS”: Remote Control Software
Protocol. This column indicates whether the logging for the Device is active (ON) or not (OFF). The additional information ON (by <Client>) indicates that the data connection was started by a DHD application. If the value ON is displayed, there is always a direct TCP/IP-connection or a serial connection.
If you want to activate or deactivate the logging for a Device in the list, make use of the contextual menu. Right-click on the selected Device. The contextual menu appears enabling you to select the commands Protocol ON or Protocol OFF respectively. If you have added a Device manually, also the Remove Device command is available. This way, you can remove the Device from the list.
Use this command to quit the DHD Communication Server. Alternatively, you can right-click on the small DHD logo in the icon tray of the Windows task bar. In the appearing context menu select the command.
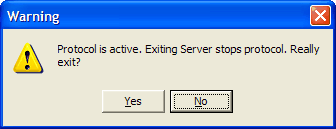
If at least one DHD application is running and uses the DHDCS, a warning message is displayed. This tells you that quitting the DHDCS can lead to errors in the DHD applications using the DHDCS.
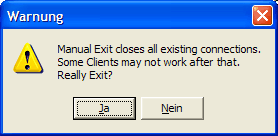
Normally, you should click on No in this dialog to continue the operation of the DHDCS and then quit all DHD applications. When you quit the last DHD application, the DHDCS is quitted automatically.
But if you click on the button, the DHDCS is quitted without respect to any DHD applications still running. In this case, the corresponding DHD application may display an error message a few seconds later. This tells you that there is no communication possible between the software and the RM4200D Devices.
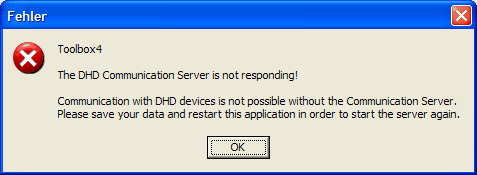
After confirming this message, you can further use the DHD application e.g. to carry out more Config changes using the Toolbox4 software. However, there is no network access to the RM4200D Devices any more!
If you want to reconnect, first save your current data and quit the DHD application. Now restart the program to automatically restart the DHDCS in the background.
![[Important]](../pics/important.gif) | Important |
|---|---|
Once you have quitted the DHD Communication Server, you can restart it by double clicking on the file DHDCS.exe! The connection to DHD applications already open can not be reopened though. In this case, you have to quit and restart the DHD applications concerned. | |
If you want to quit the DHDCS while a logging function is active, an error message is displayed telling you that quitting the server will interrupt the logging.
After you confirmed the security check, the logging function and the server are quitted. If you do not confirm, the operation is continued and the DHDCS is not quitted. (see also Options, Logging)
![[Important]](../pics/important.gif) | Important |
|---|---|
If you have activated the logging function for a Device in the Device list, it only remains active as long as the DHDCS is running. If the server is quitted or restarted, you have to reactivate the logging function for this Device. If you switch off the monitored DSP frame, the logging function is not stopped. When the Device is switched on again and transfers data under a known IP address, the protocol is continued. This may be useful for long-term protocols when the monitored Device is not always switched on. | |
Use this menu to control which data is recorded by the DHD Communication Server.
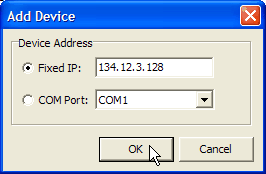
Use this command to manually set up a connection to a RM4200D. This is necessary if the Device is either connected to your PC via a serial port or if it can not register using UDP broadcasts. After selecting this command, the following dialog opens:
Now, you have the following options to set up a connection to the Device:
Fixed IP. If you know the IP address of a Device, you can enter it here. This is useful if the PC with the DHD Communication Server and the RM4200D can not communicate using the UDP protocol, but the IP address of the Device is known.
COM Port. Select this option if you want to connect a Device to the PC using the serial port. Use the popup menu to select the correct port. Make sure that this port is not used by other programs already!
Now close the dialog by clicking on the button. The device you just added is displayed in the list.
![[Note]](../pics/note.gif) | Note |
|---|---|
If you have added a Device to the list manually, from this moment on, it is available to all DHD applications able to access the DHDCS. | |
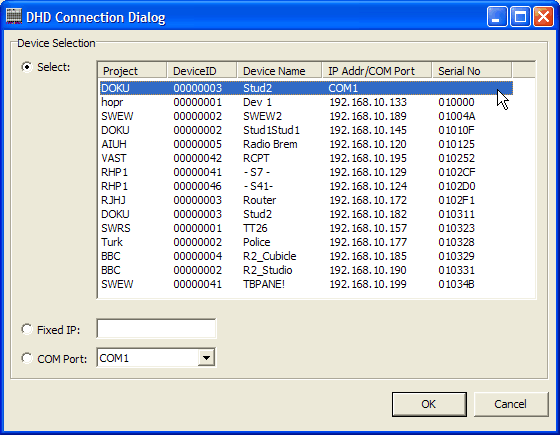
In the following figure you see a Device that is available to the serial port of a PC in the Toolbox4 software. It is located in the Select area in the DHD Connection dialog.
Use this command to remove a Device from the Device list, if you have added it before using the command. Highlight the Device in the list and then select the command . Alternatively, you can also right-click on the desired entry and select the command from the contextual menu.
![[Tip]](../pics/tip.gif) | Tip |
|---|---|
You should remove a Device from the list if the UDP communication between the Device and the PC is working again. In this case, the Device registers automatically and then appears in the list twice. Remove the Device that was added manually to the serial port. Now, data transfer is carried out using the faster Ethernet port. | |
![[Important]](../pics/important.gif) | Important |
|---|---|
If you want to interrupt an existing serial connection to a Device, do the following: First remove the Device from the Device list before interrupting the connection! If not, this can cause error messages when interrupting the connection. | |
Eventually it can happen that a lot of messages are displayed in the logging pane of the DHD Communication Server within a short period of time. The amount of incoming messages depends on how many Devices are monitored and what kind of messages are included into the logging. If the window is scrolling very quickly in this situation, you can stop the display using the command. Select this command again to continue the display. The logging indicates how many messages were skipped while the display was stopped.
![[Note]](../pics/note.gif) | Note |
|---|---|
If you have configured in the options that the messages are recorded in a logging file, the output continues even if the display was stopped. | |
Use this command to delete the contents of the logging pane. A possible output of the messages in a logging file is not influenced by this.
In the options, if you have activated logging to a file, this command opens the file in the standard editor of the PC.
Use this command to control the way the DHD Communication Servers works. If you have selected the command, the options dialog opens. It contains two tabs, Logging and Extended Logging. You use them to control the way the logging works.
![[Note]](../pics/note.gif) | Note |
|---|---|
All settings in the options dialog keep their current values even if the DHD Communication Server is quitted. | |
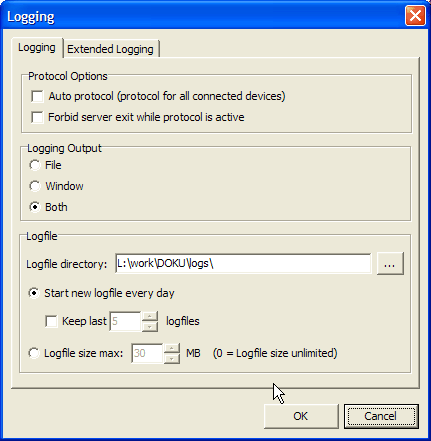
In the Logging tab, set the general protocol options. You can use the following controls:
Protocol Options. If you activate the checkbox Auto protocol (protocol for all connected devices), the DHD Communication Server records the messages for every Device a DHD application connects to – either via TCP/IP or via the serial port. If this condition is active, the column Protocol in the Device list will show ON for each Device affected. You can e.g. create log entries if you select a Device in the Device tree in the Toolbox4 Maintenance Window or if you load a Config to the Device. By default, the checkbox is off.
![[Tip]](../pics/tip.gif)
Tip Switch on this option if you want to monitor how other DHD applications (not running on your PC) communicate with a DSP frame. Keep in mind that certain actions, e.g. updating the firmware, can create more data in the protocol.
Switch on the checkbox Forbid server exit when protocol is active if you want to avoid that the DHDCS is quitted while recording a logging. This way, you can make sure that a long term logging can not be interrupted accidentally. If this option is active and you try to quit the DHDCS, the message Protocol is active, Server could not stop is displayed. In this case, the DHDCS can not be quitted as long as a logging is active. By default, this checkbox is off.
![[Important]](../pics/important.gif)
Important If you have switched on the checkbox Forbid server exit when protocol is active and a log is being recorded for a Device, the PC can not be shut down just like that. Windows recognizes an active DHD application and requires to quit it or to interrupt the shut down. Other active programs on the PC can be quit by the system, though.
Logging output. Use these three radio buttons to determine where the logging information should go. The File option outputs the logging only into a file, the option Window displays the messages only to the logging area and the Both option writes data both into the logging area and to the file. By default, the latter option is active.
Logfile. Here, you can set where the logging data is saved. Use the Logfile directory entry box to enter the path to the destination directory for the log files. At the first start-up of the DHD Communication Server, the directory is inserted, into which the program file DHDCS.exe is extracted.
The log files contain the log entries as ASCII text and are named according to the scheme DHDyyyy-mm-tt.log (e.g. DHD2004-01-16.log) yyyy indicates the year, mm the month and tt the day when the protocol file was started.
![[Important]](../pics/important.gif)
Important If you select a directory for the protocol files, you have to make sure that your current Windows user account has write permission to this directory!
Use the following two radio buttons to determine when a new log file should be started. If the option Start new logfile every day is selected, the DHDCS starts a new file every day at midnight. In addition, you can activate the Keep last <No> logfiles checkbox to keep as many log files as stated under <No>. By default, the last five files are kept; but you can set all values between 1 and 100.
If you activate the radio button Logfile size max: <No> MB though, the size of the log file is limited to the number stated (in megabytes). As soon as the file reaches this size, the oldest files are overwritten. Here, the default setting is 30þmegabytes. If you set the value for the maximum size to 0 MB, the log file may be unlimited.
![[Important]](../pics/important.gif) | Important |
|---|---|
Depending on the number of logged Devices and the selected settings, log files can reach a size of 100 MB or more. Therefore make sure that sufficient space is available on the hard disk of the PC! | |
In this tab you can configure how UDP messages are filtered before being logged. The values set here influence the incoming messages of all monitored Devices. Only messages that match with the set filter criteria are logged.
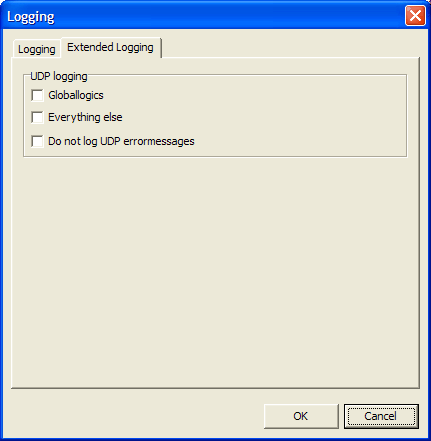
In the tab UDP Logging, you can use the following options:
Globallogics. Activate this checkbox if you want to log all UDP messages transferring changes to Global Logic functions.
Everything else. If this checkbox is active, all UDP commands that belong to the same project are logged, including routing commands, status messages of Global Resources and settings for Global Potentiometers.
Do not log UDP error messages. If this checkbox is active, UDP messages are suppressed that normally are output as “error conditions”. This includes e.g. the over modulation of inputs, changes of the synchronization sources or problems with DSP cards.
![[Warning]](../pics/warning.gif)
Warning Use this option only in exceptional cases and only over a limited period of time. If you leave it switched on accidentally, important information can be lost.
By default, none of the checkboxes is switched on. If you activate one of them, the DHD Communication Server starts logging the incoming messages. Accordingly, all settings become active that you have chosen for logging.
![[Important]](../pics/important.gif) | Important |
|---|---|
All settings in the pane Extended Logging are only active as long as the DHD Communication Server is running. If the program is quitted and restarted, all options are reset to their default values. | |
